


How is Swiggy using ML to process payments?💰
Insights into the ML model for optimal payment routes.


Quick Context 📝
Swiggy relies on Payment Gateways(PG), a service that helps facilitate online payments for e-commerce transactions. It acts as a bridge between a merchant's website and the payment processor that handles the transaction. Swiggy accepts various payment methods like card-debit/credit, UPI, net banking, wallets, etc. To make a transaction go through using the desired mode of payment, players like the PGs, card networks(VISA, Rupay, etc.), banks, and UPI networks must be active.
A failed payment experience leads to poor customer experience and results in customers dropping off.
To solve this, Swiggy has been using an ML approach for routing transactions through the optimal payment routes. Let’s understand the science behind this!
Deep dive into the Rabbithole:🪄
Key Metric to track: Payment Success Rate(PSR)
Swiggy chose to develop 3 different ML Models for the PG routing use cases based on the payment method and the unique challenges it brings in.
The design choice was made considering the following edge cases:
Same PG and variable performance across different payment methods
Not all PGs support all payment methods.
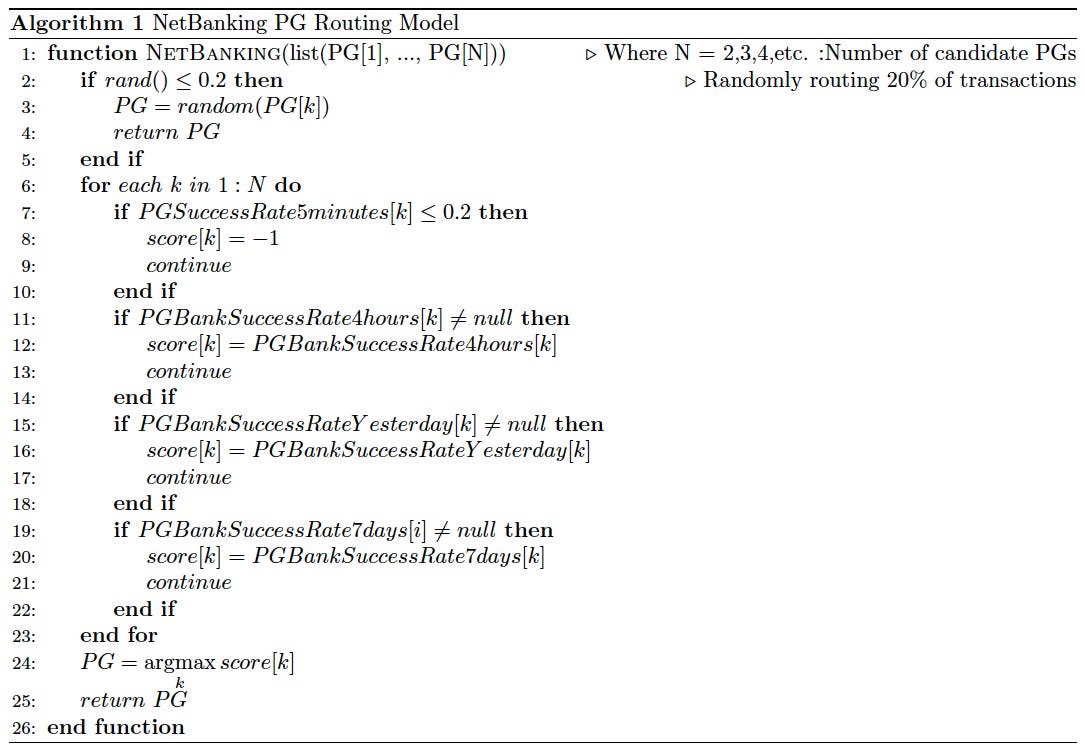
The Netbanking PG Routing Model 🏦
To maximize the PSR of net banking transactions, the model identifies the success trend rate of the bank with each PG to decide the optimal routing.
For example, Bank A, let’s say Federal Bank, is the customer bank. The success rate trend of Bank A with PG1, PG2, etc. in the previous x hours/minutes gives a reasonable estimate of each PG’s potential to carry out that transaction.
For net banking transactions, it was decided to implement an explore-exploit model. How does this work? Let’s understand!
Explore-Exploit Framework:
Consider the following two metrics:
Bank Level success rates
PG-Level success rates
The exploit part is a rule-based model which uses PG, Bank-level success rates in the previous 4 hours, one day, and seven days and PG-level success rates in the previous five minutes. The rule-based model returns a score for each PG based on the most recent available success rate value. The transaction is hence routed to the PG with the highest score. This way the model “exploits” the best scenario to deliver the optimal results.
Problem 😫
The problem with having only the exploit approach is it keeps prioritizing the PG that performed the best at first and the other PGs (even though their performance may have improved) stay ignored.
Enter Exploration Logic…
The exploration logic allocates each transaction to the available PGs uniformly at random, hence helping in providing a reasonable estimate of the success rate of all the PGs at all times.
What percent of the transactions would be a part of the exploration cohort?
Experiments helped Swiggy reach 20% as exploration size to help estimate the top banks’ PG-level success rate.
In conclusion, the explore model helps in the collection of unbiased data that can be used for model improvements and evaluation and to check for scores across various PGs at the same time. In contrast, the exploit model identifies the best PG to optimize the overall PSR of net banking transactions.

The UPI PG Routing Model:
Beta Distribution:
The model involves the use of sampling from Beta Distribution to score PGs.(The ‘for’ loop in the algorithm corresponds to this part.)
Random Experiment: Routing a UPI transaction through a PG
Outcome: Success or Failed signal
Score:
The experiment uses several successful and failed orders for each PG in the recent x amount of time. A value is sampled from the resulting Beta Distribution to estimate the PG’s success probability. The transaction is hence routed to the PG with the highest sample value.
Example:
Consider PG1:
SuccessOrders=5
FailedOrders=5
in the previous 15 minutes.
Resulting Beta Distribution:
Y-axis: Density, X-axis: the probability of success

Consider PG2:
SuccessOrders=5
FailedOrders=5
in the previous 15 minutes.
Resulting Beta Distribution:
Y-axis: Density, X-axis: the probability of success

The mean for both distributions is 0.5, but when sampling values, the variance of the sampled values is less in the case of the PG2 compared to the PG1.
This implies that when you sample values from the second distribution, the values will tend to be closer to the mean of 0.5 than they would be if you were sampling from the first distribution. In other words, the values in the second distribution are less spread out and are more likely to be close to the mean.
Explore-Exploit Framework:
This results in high exploration when fewer transactions are routed via a PG (PG1 in this case) and more exploitation when more transactions are routed via that PG (PG2 in this case).
About 5% of the transactions are randomly routed to collect unbiased data for model improvements and evaluation. (The“if” statement in the algorithm corresponds to this.)


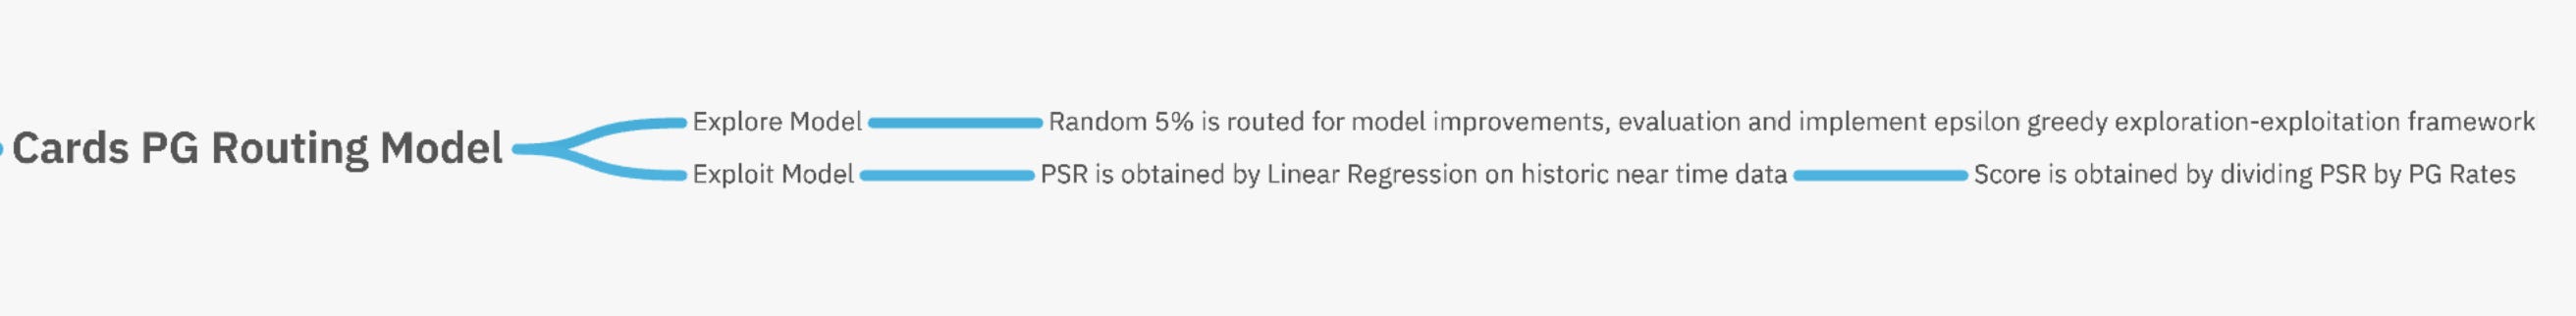
The Cards PG Routing Model:
Logistic Regression:
The model used for the exploit function is the model trained on historical transaction data to obtain PG PSR.
Score:
The score is obtained by dividing the PSR by the PG rate. This is a post-processing step to account for the PG rate and penalizes the PGs with high costs. This optimizes both PSR and the PG rate.
Explore-Exploit Framework:
To address the issue of success rates for different card and PG combinations not being stationary, the model implements an epsilon greedy exploration-exploitation framework. This means that a small percentage (5%) of transactions are randomly routed to PGs other than the one with the highest predicted probability of success, to gather more data on the success rates of these PGs. This exploration data can be used to update the model and improve its performance. The remaining 95% of transactions are routed using the exploit model, which optimizes for both payment success rate (PSR) and PG cost.
The “if” statement corresponds to explore part
The “for” loop corresponds to exploit part

Systems involved in PG Routing:

“Payments as a Service” Engineering is used by different business verticals of Swiggy. How does it work?
PaaS requests for optimal PG. This request is made to the Data Science Platform(DSP) (PG routing models are deployed on the DSP), which in turn fetches feature values for the model to infer.
Redis Feature Store is fed data by:
RILL for near real-time features which is an in-house Apache Flink-based tool for near real-time stream data processing
Spark SQL Jobs for historical features.
The DSP relays back model predictions to Engineering Service.
Lessons that can be learned from Swiggy Case Study:
ML can improve decision-making through data analysis.
ML can improve efficiency by streamlining operations and choosing cost-efficient options.
ML can improve business by continuously learning and adapting to changes.
That was the Swiggy-Payments ML Model breakdown ✨
If you derived valuable insights from this post, share this with your friends on WhatsApp.
Also, do not forget to subscribe to the ProductX newsletter for more insightful technical case studies, delivered right to your inbox. 👇🏻
References for the article:
Swiggy Engineering Blog: https://bytes.swiggy.com/an-ml-approach-for-routing-payment-transactions-5a14efb643a8